S&P 500 Momentum Just Went Vertical: The Last 4 Times It Did, Stocks Sold Off
Apple Inc. AAPL | 0.00 | |
Advanced Micro Devices, Inc. AMD | 0.00 | |
Amazon.com, Inc. AMZN | 0.00 | |
Broadcom Limited AVGO | 0.00 | |
Cisco Systems, Inc. CSCO | 0.00 |
Something rare just happened beneath the surface of the U.S. equity market, and almost nobody is talking about it.
The SPDR S&P 500 ETF Trust (NYSE:SPY) hit 14 new closing highs in the past month alone. And yet the median S&P 500 stock trades 13% below its own 52-week peak, according to Goldman Sachs Portfolio Strategy lead Ben Snider in a research note dated Friday.
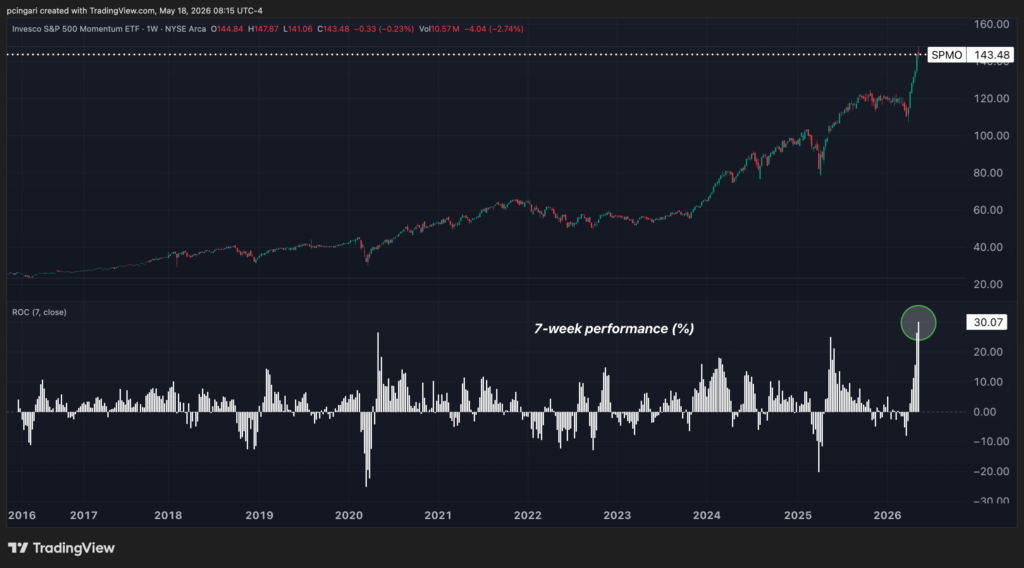
Meanwhile, momentum stocks have surged even more aggressively. Over a seven-week stretch, the Invesco S&P Momentum ETF (NYSE:SPMO) has rallied 30% — the strongest gain since the fund launched in 2016.
Goldman Sachs studied comparable episodes since 1980 and the pattern is unambiguous. Near market highs combined with sharp momentum rallies preceded weak forward returns.
What Is The Momentum Factor?
Think of the Momentum factor as a horse race scoreboard for the entire S&P 500.
Every month, it ranks all 500 stocks by their trailing 12-month return, goes long the top quintile, shorts the bottom quintile, and rebalances. When the same names keep winning, the factor climbs.
When laggards suddenly surge or leaders crack, the factor reverses.
Today, the long leg is dominated by the AI trade.
Semiconductors, tech hardware and capital goods names are tied to the AI data-center build-out, plus energy and transportation. The short leg is loaded with software and commercial services stocks that the market believes AI will disrupt.
In other words, the Momentum factor right now is essentially a leveraged bet on the AI capex cycle.
That is why Goldman writes that AI and Momentum are now trading “hand in hand” and that many portfolio managers describe today’s tape as “one big trade” rather than a market of stocks.
Tech And AI Explained 85% Of S&P 500’s YTD Returns
Through May 14, the S&P 500 returned 10% year-to-date. TMT (tech, communication services, plus Amazon.com Inc. (NASDAQ: AMZN) and Tesla Inc. (NASDAQ:TSLA)) supplied 85% of that return.
The S&P 500 excluding TMT returned just 3%.
Nvidia Corp. (NASDAQ:NVDA) alone, at 9% of index weight, contributed 20% of the entire YTD return.
Just 10 names, just 2% of S&P 500 constituents, supplied roughly 78% of the S&P 500’s YTD return through mid-May. The other 490 stocks combined contributed less than a quarter of the overall index return.
| Company | Weight | YTD Return | SPY Contribution |
|---|---|---|---|
| Nvidia Corp. | 8.90% | +20.82% | +168 bp |
| Alphabet Inc. (NASDAQ:GOOGL) (NASDAQ:GOOG) | 6.52% | +26.15% | +148 bp |
| Micron Technology Inc. (NASDAQ:MU) | 1.36% | +154.01% | +90 bp |
| Apple Inc. (NASDAQ:AAPL) | 6.80% | +10.64% | +71 bp |
| Broadcom Inc. (NASDAQ:AVGO) | 3.24% | +23.11% | +66 bp |
| Advanced Micro Devices Inc. (NASDAQ:AMD) | 1.14% | +98.03% | +62 bp |
| Intel Corp. (NASDAQ:INTC) | 0.85% | +194.77% | +61 bp |
| Amazon.com Inc. (NASDAQ:AMZN) | 4.06% | +14.44% | +56 bp |
| SanDisk Corp. (NASDAQ:SNDK) | 0.32% | +492.98% | +29 bp |
| Cisco Systems Inc. (NASDAQ:CSCO) | 0.71% | +55.12% | +28 bp |
| Top 10 Total Contributors | 33.74% | — | +779 bp |
Four Parallels That Should Look Familiar
Goldman names four episodes where sharp Momentum rallies coincided with the S&P 500 at or near a high. Each one is a useful warning rather than a forecast.
July 1998: Russian Default, LTCM, Asian Contagion: The S&P 500 was at fresh highs when Momentum surged. Within three months, the index was down 15%. The Russian government defaulted in August, Long-Term Capital Management blew up in September, and the Fed engineered a private-sector rescue. A year later the index had recovered to 20%, but the path through the catch-down was brutal.
September 1999: Late Dot-Com Melt-Up. The S&P 500 sat 5% off its high when Momentum rallied. Twelve-month forward return: 11%. The Nasdaq peaked just months later in March 2000 and lost 78% over the following two and a half years. The index masked the carnage in the average tech stock.
July 2015: Energy Collapse And China Devaluation. S&P 500 was within 1% of its high. Three months later: -2%. Six months later: -10%. The August 2015 flash crash and the January 2016 oil-led selloff both followed.
October 2021: Final Pre-Hike Blow-Off. S&P 500 at the highs. Twelve-month forward return: -18%. The Fed pivoted hawkishly in November 2021, the meme-stock bubble cracked, and the 2022 bear market took the index down 25% peak-to-trough.
Overall, 11 episodes of momentum rallies near market highs since 1980 produced median S&P 500 returns of -1% at 1 month, 0% at 3 months, +1% at 6 months, +3% at 12 months.
Photo: Shutterstock