The Trend Catcher | ATEYY (+10%) Leads Electronic-Semiconductor Equipment Sector; CRDO Hits ATH, 2x Leveraged ETF Surges Over 20%; BURL (+3%), SN (+2%) Among 4 Stocks Near Breakouts
ADVANTEST CORP ATEYY | 0.00 | |
KLA KLAC | 0.00 | |
Atomera ATOM | 0.00 | |
Advanced Energy Industries AEIS | 0.00 | |
Lam Research LRCX | 0.00 |
Subscribe to "The Trend Catcher Topic," tracking hottest sectors & technical breakouts in real time daily, accompanying you every US stock trading day.
1. Leader industry as of 5:22 pm
| Name | Price % Chg | Ind Group Rank | Ind Grp Rnk Last Week | Ind Grp Rnk 3 Mo Ago | Number of Stocks | % Chg YTD | Ind Mkt Val (bil) |
|---|---|---|---|---|---|---|---|
| Elec-Semiconductor Equip | 7.19 | 3 | 3 | 13 | 33 | 69.1 | 2,277.5 |
| Elec-Contract Mfg | 4.60 | 10 | 2 | 53 | 15 | 66.0 | 196.4 |
| Elec-Semiconductor Mfg | 4.30 | 11 | 8 | 18 | 33 | 55.4 | 3,722.6 |
| Computer-Hardware/Perip | 4.11 | 5 | 1 | 3 | 36 | 187.3 | 1,934.6 |
| Energy-Solar | 3.85 | 65 | 15 | 79 | 23 | 3.5 | 63.1 |
Elec-Semiconductor Equip Related Stocks: ADVANTEST CORP(ATEYY.US), KLA(KLAC.US), Atomera Incorporated(ATOM.US), Advanced Energy Industries, Inc.(AEIS.US). Lam Research Corporation(LRCX.US).
Daily US Equity Brief: AI Demand "Hot" vs. Market Structure "Cold"
Key Takeaway
Yesterday's US equities presented a sharp divergence between solid AI fundamentals and fragile trading structures. AI infrastructure hard data continued to validate (Oracle RPO hitting $638 billion), but leveraged ETFs, liquidity evaporation, and macro pressures are amplifying volatility. Gold plunged 4% to a yearly low, silver broke key support, and the market is shifting from "price discovery" to "flow-driven" trading.
I. AI Infrastructure: Demand Still "Adding Fuel to the Fire"
The strongest signal came from Oracle: The strongest signal came from Oracle Corporation(ORCL.US): Q4 revenue of $19.2 billion (+21% YoY), cloud infrastructure revenue up 93%, and RPO (remaining performance obligations) surging to $638 billion. The company signed $67 billion in AI infrastructure contracts in the quarter. FY27 capex guidance of $90–95 billion confirms compute demand is not cooling.
Memory becomes the new hard bottleneck: Memory prices have risen more than sixfold over the past year. Morgan Stanley expects DRAM supply shortages to persist through 2028. Micron and SanDisk saw upward target price revisions from investment banks, with long-term agreements (LTAs) potentially driving PE re-rating from 5x to 8–10x.
Optical communication (CPO) sees divergence: SemiAnalysis claimed CPO mass production could be delayed to 2029, triggering sector selloffs. However, Lumentum's CEO stated all CPO capacity is already booked. Conclusion: long-term trend intact, but near-term timing debate does not change copper cabling and pluggable optics' transitional beneficiary logic.
800V architecture delayed: NVIDIA's single-ended 800V DC mass adoption pushed to 2028, pressuring SiC/GaN names (WOLF -12%). However, the industry's shift to higher voltage remains on track.
II. Market Structure: Leverage and Liquidity "Freeze"
Leveraged ETFs are hijacking the market: Daily Semiconductor Bear 3x Shares(SOXS.US) saw over 1.3 billion shares traded yesterday, the third-largest single-day volume for any US-listed ETF in nearly 20 years. The entire leveraged/inverse ETF complex traded $90 billion. Mechanical rebalancing (short gamma) is amplifying volatility to levels decoupled from fundamentals.
Goldman Sachs warns of liquidity drought: S&P 500 order book top-of-book depth has fallen to its lowest level since April 2025. CTA strategies are within 1.01% of triggering short-term thresholds. A breakdown would unleash mechanical selling that compounds downside.
Gold's crash reveals risk appetite inflection: Gold plunged 4% to a new yearly low, and silver broke below its 200-day moving average. This is not a failure of safe havens—it's liquidity stress forcing investors to sell everything, including traditional hedges.
Rotation signals emerge: Tech fell over 10% in a week, while healthcare, financials, and utilities gained 2%+. The market is transitioning from an "AI-everything" narrative toward multi-sector repair.
III. Key Catalysts to Watch
- Oracle's follow-up financing plan: RPO looks strong, but ~$40 billion in additional funding is needed for FY27. Capital structure will become the next focus.
- SpaceX(SPCX.US) IPO pricing and trading: The largest IPO in history (~$1.78 trillion valuation) serves as a thermometer for market risk appetite.
- Macro data and geopolitics: CPI breaking 4%, US-Iran tensions pushing oil higher, and the 10-year Treasury yield back above 4.5% form a triple headwind for valuations.
One-Sentence Summary: The AI story hasn't changed, but the trading story has. Assets with firm orders, supply bottlenecks, and long-term agreements remain ownable; but in an environment of leveraged ETFs and liquidity evaporation, any chase can be mechanically punished. The first priority is not to find new themes, but to distinguish "fundamental logic" from "flow noise."
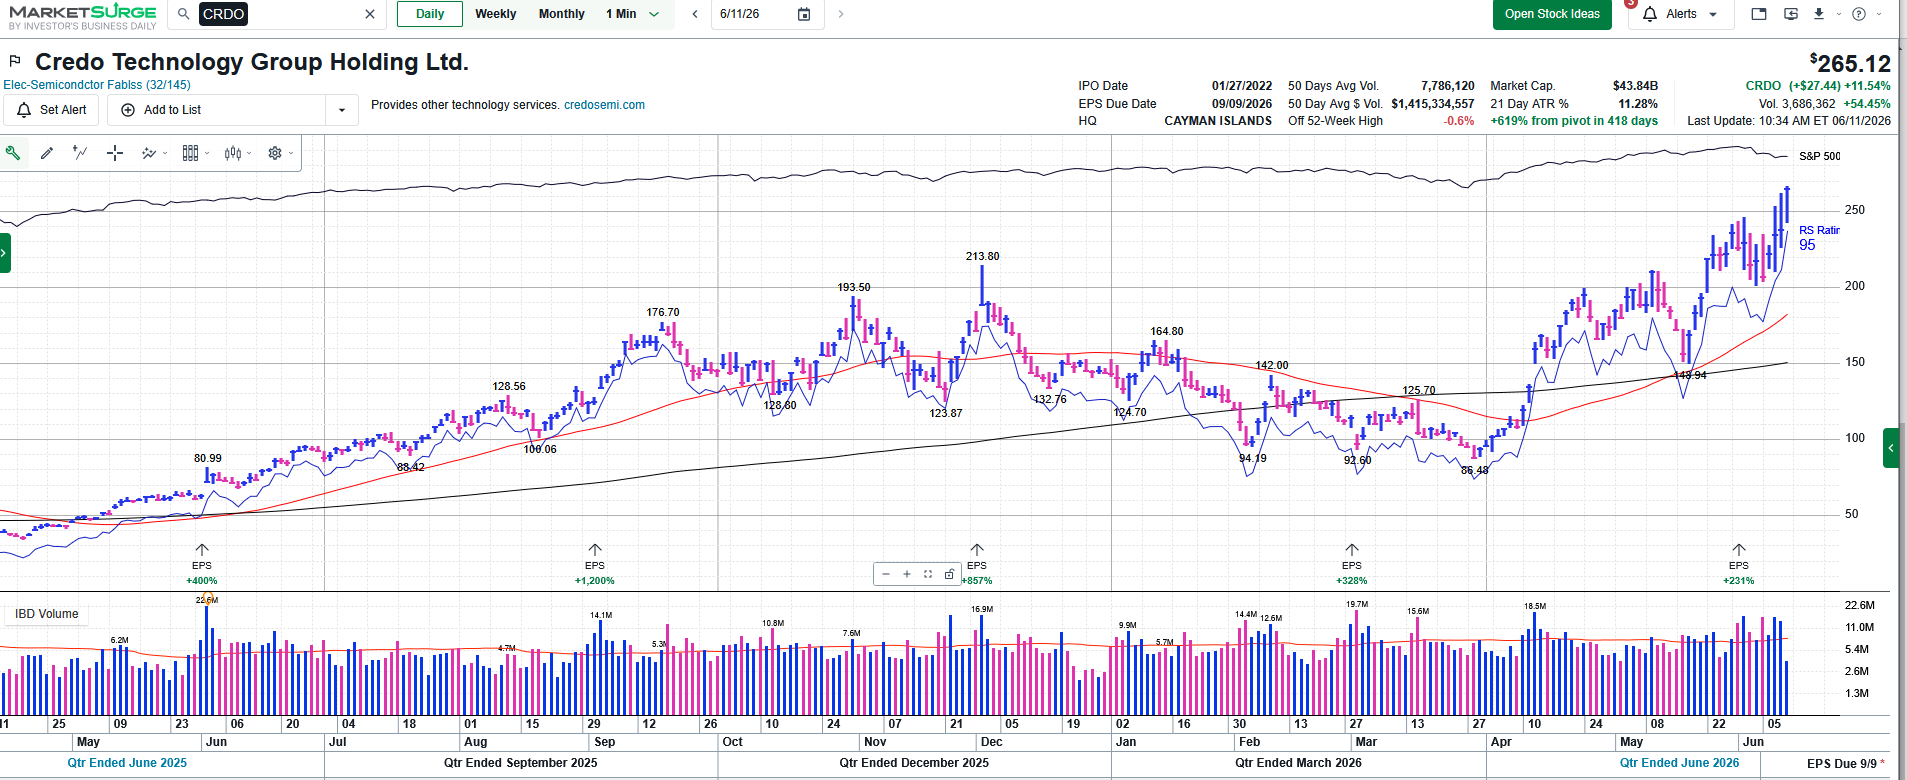
2. Breaking Out Today as of 5:22 pm
| Symbol | Comp Rating | Industry Name | Current Price | Price % Chg | Volume (1000s) | Price $ Chg | EPS Rating | RS Rating | Ind Group RS | SMR Rating | A/D Rating | Market Cap (mil) |
|---|---|---|---|---|---|---|---|---|---|---|---|---|
| Credo Technology(CRDO.US) | 99 | Elec-Semiconductor Fabless | 265.93 | 11.88 | 3,508 | 28.25 | 83 | 95 | A- | A | B+ | 43,840.1 |
Related ETF: Tradr 2X Long CRDO Daily ETF(CRDU.US)
3. Near Breakouts as of 5:22 pm
| Symbol | Comp Rating | Industry Name | Current Price | Price % Chg | Volume (1000s) | Price $ Chg | EPS Rating | RS Rating | Ind Group RS | SMR Rating | A/D Rating | Market Cap (mil) |
|---|---|---|---|---|---|---|---|---|---|---|---|---|
| Burlington Stores, Inc.(BURL.US) | 97 | Retail-Apparel/Shoes/Acc | 336.76 | 2.98 | 57 | 9.75 | 94 | 74 | B+ | A | A- | 20,582.7 |
| SharkNinja(SN.US) | 99 | Hsehold-Appliances/Wares | 130.85 | 2.05 | 198 | 2.63 | 95 | 78 | A- | A | A | 18,145.7 |
| Super Group (SGHC) Limited(SGHC.US) | 95 | Leisure-Gaming/Equip | 13.95 | 1.64 | 1,807 | 0.23 | 93 | 84 | B- | A | C- | 6,970.8 |
| Merck & Co., Inc.(MRK.US) | 78 | Medical - Pharmaceuticals | 120.82 | 1.45 | 1,468 | 1.73 | 71 | 71 | B | B | E | 294,131.4 |
Subscribe to The Trend Catcher Topic / The Value Anchor Topic —unlock the full historical archive and never miss a weekly pick again.
Stocks In Focus:
| Company Fundamentals | Details |
|---|---|
| EPS Due Date | 9/9/2026 |
| EPS % Chg (Last Qtr) | 231% |
| 3-Year EPS Growth Rate | 0% |
| EPS Est % Chg (Current Yr) | 124% |
| Annual ROE | 34% |
| Sales % Chg (Last Qtr) | 157% |
| 3-Year Sales Growth Rate | 107% |
| Debt % | 1% |
| Market Cap | $44 Billion |
| Annual Pre-Tax Margin | 38.44% |
| Sector | Chips |
| Industry Group | Elec-Semiconductor Fabless |
| Industry Group Rank | 32 |
More of Our Investment Philosophy>>
Disclaimer: The content is provided as general information only and should not be taken as investment advice. All the contents shall not be taken as a recommendation to buy or sell any security or financial instruments. Any action you take resulting from information, analysis, or commentary on this article is your responsibility. Please consult your investment advisor before making any investments.