The Trend Catcher | Last Week's Pick MRVL Up 54.48%, 64.3% Win Rate; Computer Sftwr-Database Industry Heat Up — Don't Miss Next Week's Biggest Moves
Flex Ltd FLEX | 0.00 | |
Jabil Inc. JBL | 0.00 | |
TTM Technologies, Inc. TTMI | 0.00 | |
Marvell Technology MRVL | 0.00 | |
Fortinet, Inc. FTNT | 0.00 |
Finding the strongest stocks inside the strongest sectors—so you can ride the market’s clearest trends.
Subscribe to The Trend Catcher Topic / The Value Anchor Topic —unlock the full historical archive and never miss a weekly pick again.
Top 5 Gainers of This Week Last Week's Review>>
| Name | 5-Day Price Change(%) |
|---|---|
| Marvell Technology(MRVL.US) | 54.48% |
| Fortinet, Inc.(FTNT.US) | 15.4% |
| Rambus Inc.(RMBS.US) | 14.41% |
| Coherent Corp.(COHR.US) | 11.92% |
| Applied Materials, Inc.(AMAT.US) | 11.57% |
1. Heating-Up Industries & Logic
Institutional insights on the popular sectors of the listed stocks. Data source from professional institutional reports.
Sorted by "Ind Group Rank"
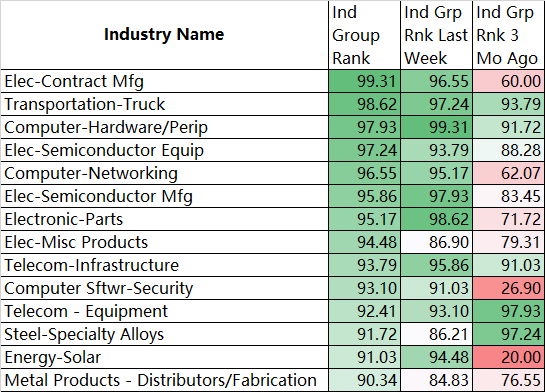
Elec-Contract Mfg (Top RS+EPS Stocks): Celestica Inc.(CLS.US) , Sanmina Corporation(SANM.US) , TTM Technologies, Inc.(TTMI.US) , Flex Ltd(FLEX.US) , Fabrinet(FN.US) , Jabil Inc.(JBL.US)
Sorted by "Rank Upgraded"
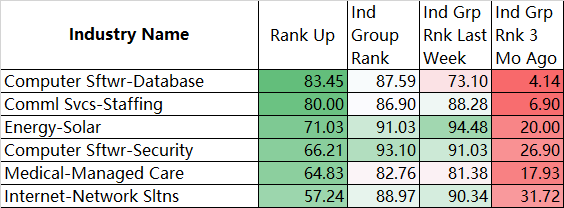
Computer Sftwr-Database (Top RS+EPS Stocks): Oracle Corporation(ORCL.US) , MongoDB, Inc. Class A(MDB.US) , Teradata Corporation(TDC.US) , Elastic N.V.(ESTC.US) , Varonis Systems, Inc.(VRNS.US) , Boost Run Inc. Class A(BRUN.US)
2. Top Stock Picks This Week
Our Stock Selection Criteria & Indicator Guide: Click for Details >>
| Symbol | Current Price | Industry Name | Ind Group Rank | Market Cap (mil) | Comp Rating |
| Flex Ltd(FLEX.US) | 159.51 | Elec-Contract Mfg | 1 | 59,331.2 | 99 |
| Jabil Inc.(JBL.US) | 373.82 | Elec-Contract Mfg | 1 | 39,989.7 | 99 |
| TTM Technologies, Inc.(TTMI.US) | 184.84 | Elec-Contract Mfg | 1 | 19,690 | 99 |
| Silicon Motion Technology Corporation Sponsored ADR(SIMO.US) | 294.67 | Computer-Hardware/Perip | 3 | 10,288.9 | 99 |
| Seagate Technology Holdings PLC(STX.US) | 925.99 | Computer-Hardware/Perip | 3 | 210,930 | 98 |
| Western Digital Corporation(WDC.US) | 575.35 | Computer-Hardware/Perip | 3 | 204,779.1 | 97 |
Analysis of Market Sectors
1. Elec-Contract Mfg
- Core Logic: The AI capex super-cycle is driving global Wafer Fab Equipment (WFE) and Electronic Manufacturing Services (EMS) into structural growth. AI infrastructure is shifting from "buying chips" to "buying systems," significantly increasing the ODM value-add for racks (Morgan Stanley notes a 35-40% increase for Rubin racks). Increasing chip design complexity and surging AI inference demand are fueling capacity expansion in advanced packaging (CoWoS) and foundry, while supply chain regionalization/localization adds incremental demand.
- Market Space: Goldman Sachs forecasts global WFE at $141B (2026), $186B (2027), and $208B (2028). Morgan Stanley expects WFE revenue of $145B in 2026 and $185B in 2027. The ODM sector trades at ~13x CY27 P/E, which is attractive. CoWoS capacity is expected to reach 1.3M wafers in 2026 and 2.0M in 2027.
- Market Dynamics: Morgan Stanley raised WFE forecasts again, ranking 2027 growth as NAND > Non-TSMC Foundry > TSMC > DRAM, upgrading LRCX to Overweight and downgrading AMAT to EW. GlobalFoundries (GFS) is accelerating its transition to data center, automotive, and IoT, targeting ~40% gross margin by 2028. Citi recommends overweight on compute semis, citing cloud capex beats. Mizuho sees Flex (FLEX) as having the potential to double.
- Stock Views (US):
- GlobalFoundries Inc.(GFS.US) : Morgan Stanley reports a slight beat, focus shifting to the upcoming Investor Day.
- Celestica Inc.(CLS.US) : Raised FY2026 revenue guidance from $17B to $19B (+53% YoY) and adjusted EPS from $8.75 to $10.15 (+68% YoY), driven by accelerating AI/ML demand.
- Flex Ltd(FLEX.US) : Mizuho sees potential to double, benefiting from growing AI hardware manufacturing demand.
- ON Semiconductor Corporation(ON.US) : BofA names it a top AI power semi pick, estimating AI-related revenue could grow >6x via SiC/GaN adoption. Raised PT.
2. Computer-Hardware/Perip
- Core Logic: AI data centers are driving explosive demand for HBM/DRAM/NAND, creating severe supply-demand imbalances and continuous tightness. Long-term agreements (LTAs) are fundamentally reshaping the memory industry’s cyclicality, transforming it from a price-elasticity trade into a long-term supply security business that locks in revenue and margin visibility. AI inference and enterprise SSD demand are opening new growth curves for NAND and HDD, while the GPU compute bottleneck cascades to large-scale cold storage.
- Market Space: According to forecasts from Micron, Samsung, and SK Hynix, total memory revenue could grow from ~$790B in 2025 to $2.255T by 2030. HBM, server DDR5, and enterprise SSDs are key growth drivers. DRAM shortages may extend to Q2 2028, and NAND to Q4 2027. Citi raised its Sandisk Corporation(SNDK.US) PT to $2,025, and Bernstein named Seagate Technology Holdings PLC(STX.US) a long-term top pick (PT $1,700).
- Market Dynamics: HBM pricing has surprised to the upside, with industry sources suggesting 2027 prices could rise 70-100% YoY. Micron’s market cap broke $1T. Goldman Sachs highlights that LTAs now cover 20-30% of industry DDR bit shipments and 60-70% of server DDR5; even if floating DDR prices fall 50% by 2029, Micron EPS could still exceed $100. Morgan Stanley warns that +600% YoY memory costs will create significant margin headwinds for hardware OEMs like DELL and HPE in 2H. Western Digital sees a >25% exabyte CAGR through 2029.
- Stock Views (US):
- Micron Technology, Inc.(MU.US) : UBS raised PT to $1,625 (from $535), citing LTA structure and EPS sustainability; Barclays PT $1,175; MS OW/$520; HSBC Buy/$750; Citi Buy/$510; JPM OW/$550.
- Seagate Technology Holdings PLC(STX.US) : Bernstein Outperform/$1,700 (Long-Term Top Pick); MS OW/$1,100; Barclays PT $1,000; BofA sees HDDs as AI data lake overflow beneficiaries.
- Western Digital Corporation(WDC.US) : Barclays PT $620 (AI training/inference/agent workloads driving UltraSMR/HAMR).
- Sandisk Corporation(SNDK.US) : Citi PT $2,025 (Kioxia ASP doubling, LTAs, AI inference SSD demand).
- Dell Technologies, Inc. Class C(DELL.US) : MS Underweight/PT $110 (strong AI server revenue but memory costs eroding profits).
- Hewlett Packard Enterprise Co.(HPE.US) : MS Equal-weight/PT $33 (networking supported by Juniper, but server checks remain weak).
| Symbol | Current Price | Industry Name | Ind Group Rank | Market Cap (mil) | Comp Rating |
| Applied Materials, Inc.(AMAT.US) | 501.7 | Elec-Semiconductor Equip | 4 | 397,591 | 98 |
| ASML Holding NV ADR(ASML.US) | 1,757.47 | Elec-Semiconductor Equip | 4 | 658,748 | 99 |
| Lam Research Corporation(LRCX.US) | 336.41 | Elec-Semiconductor Equip | 4 | 429,833.8 | 99 |
| MKS Inc.(MKSI.US) | 330.23 | Elec-Semiconductor Equip | 4 | 22,637.4 | 98 |
| Cisco Systems, Inc.(CSCO.US) | 130 | Computer-Networking | 5 | 498,591.5 | 98 |
| Analog Devices, Inc.(ADI.US) | 428.76 | Elec-Semiconductor Mfg | 6 | 213,183.4 | 99 |
| ASE Technology Holding Co., Ltd. Sponsored ADR(ASX.US) | 38.4 | Elec-Semiconductor Mfg | 6 | 86,308.2 | 98 |
| MACOM Technology Solutions(MTSI.US) | 382.74 | Elec-Semiconductor Mfg | 6 | 29,781.3 | 99 |
| NXP Semiconductors NV(NXPI.US) | 322.22 | Elec-Semiconductor Mfg | 6 | 81,265.4 | 95 |
| Taiwan Semiconductor Manufacturing Co., Ltd. Sponsored ADR(TSM.US) | 444.92 | Elec-Semiconductor Mfg | 6 | 2,001,527.5 | 99 |
| Texas Instruments Incorporated(TXN.US) | 305.37 | Elec-Semiconductor Mfg | 6 | 280,845.5 | 93 |
| Coherent Corp.(COHR.US) | 421.9 | Electronic-Parts | 7 | 81,665.7 | 99 |
| Fortinet, Inc.(FTNT.US) | 149.67 | Computer Sftwr-Security | 9 | 107,318.3 | 99 |
| Palo Alto Networks, Inc.(PANW.US) | 279.25 | Computer Sftwr-Security | 9 | 228,830.9 | 99 |
| First Solar, Inc.(FSLR.US) | 314.95 | Energy-Solar | 12 | 34,197 | 99 |
| Nextpower(NXT.US) | 150.32 | Energy-Solar | 12 | 22,010.7 | 98 |
| Constellium SE Class A(CSTM.US) | 36.15 | Steel-Specialty Alloys | 13 | 4,882.4 | 99 |
| Century Aluminum Company(CENX.US) | 66.43 | Metal Products - Distributors/Fabrication | 14 | 6,634.7 | 95 |
| Steel Dynamics, Inc.(STLD.US) | 276.85 | Steel-Producers | 15 | 39,677.3 | 97 |
| nVent Electric plc(NVT.US) | 173.88 | Electrical-Power/Equipmt | 20 | 28,525.9 | 99 |
| Caterpillar Inc.(CAT.US) | 940.48 | Machinery-Constr/Mining/Farming | 22 | 426,632.8 | 98 |
| Advanced Micro Devices, Inc.(AMD.US) | 523.2 | Elec-Semicondctor Fablss | 23 | 884,633.4 | 99 |
| QUALCOMM Incorporated(QCOM.US) | 242.57 | Elec-Semicondctor Fablss | 23 | 263,510.5 | 96 |
| Rambus Inc.(RMBS.US) | 169.35 | Elec-Semicondctor Fablss | 23 | 18,454.7 | 99 |
| SLB Limited(SLB.US) | 58.01 | Oil&Gas-Field Services | 24 | 84,994 | 91 |
| Hudbay Minerals Inc(HBM.US) | 30.12 | Mining-Metal Ores | 31 | 12,065.1 | 92 |
| Teck Resources(TECK.US) | 67.28 | Mining-Metal Ores | 31 | 32,985.7 | 97 |
| Goldman Sachs Group, Inc.(GS.US) | 1,092.61 | Banks-Money Center | 37 | 307,108.6 | 99 |
| Morgan Stanley(MS.US) | 218.27 | Banks-Money Center | 37 | 331,450.6 | 99 |
Screening Philosophy: based on ratings of financial data, stock relative price strength, and industry sector effects to screen for and capture opportunities in the currently hottest market sectors and strongest individual stocks;
Filters Applied: Comp Rating ≥85; RS Rating ≥85; Ind Group RS: A; SMR Rating: A,B; Price ≥$20; Vol. ≥1000k; Market Cap. ≥3B; Sorted by Ind Group Rank;
Stock Selection Period: as of Friday;
About 'The Trend Catcher' Column:
Finding the strongest stocks inside the strongest sectors—so you can ride the market’s clearest trends.
We combine quantitative relative strength screens with real-time thematic analysis to highlight capital’s favorite directions.
All views are sourced from public market data and institutional research, for informational purposes only and not personalized investment advice.
Tune in to today’s dominant momentum.Subscribe to The Trend Catcher Topic — unlock the full historical archive and never miss a weekly pick again.
Disclaimer: The content is provided as general information only and should not be taken as investment advice. All the contents shall not be taken as a recommendation to buy or sell any security or financial instruments. Any action you take resulting from information, analysis, or commentary on this article is your responsibility. Please consult your investment advisor before making any investments.