The Trend Catcher | SPCX Up Over 11%; TER (+6%), UAL (+4%), Computer-Hardware Sector Leads Market As Oil Falls, Risk Assets Rally; UNTY Near ATH
Dell Technologies, Inc. Class C DELL | 0.00 | |
Silicon Motion Technology Corporation Sponsored ADR SIMO | 0.00 | |
Micron Technology, Inc. MU | 0.00 | |
LENOVO GROUP LIMITED LNVGY | 0.00 | |
NetApp, Inc. NTAP | 0.00 |
Subscribe to "The Trend Catcher Topic," tracking hottest sectors & technical breakouts in real time daily, accompanying you every US stock trading day.
1. Leader industry as of 5:51 pm
| Name | Price % Chg | Ind Group Rank | Ind Grp Rnk Last Week | Ind Grp Rnk 3 Mo Ago | Number of Stocks | % Chg YTD | Ind Mkt Val (bil) |
| Computer-Hardware/Perip | 7.41 | 2 | 2 | 3 | 36 | 243.5 | 2,148.50 |
| Mining-Gold/Silver/Gems | 6.96 | 132 | 138 | 39 | 87 | -0.2 | 710.6 |
| Finance - Crypto/Blockchain | 5.88 | 71 | 102 | 108 | 78 | 18.4 | 225.5 |
| Telecom-Infrastructure | 5.77 | 16 | 21 | 9 | 22 | 68 | 1,379.70 |
| Electronic-Parts | 5.37 | 10 | 7 | 36 | 22 | 63.4 | 556.5 |
Computer-Hardware/Perip Related Stocks: Dell Technologies, Inc. Class C(DELL.US), Silicon Motion Technology Corporation Sponsored ADR(SIMO.US), Micron Technology, Inc.(MU.US), LENOVO GROUP LIMITED(LNVGY.US), NetApp, Inc.(NTAP.US).
Daily US Equity Brief: Risk Appetite Returns – SpaceX Ignites Sentiment as AI Infrastructure Rebounds
Core Thesis: Yesterday's (June 12) U.S. market was defined by a broad-based risk-on rally. Falling oil prices, easing Middle East tensions, and the blockbuster debut of SpaceX helped restore investor confidence. While the AI theme remained central, leadership broadened beyond mega-cap tech into semiconductors, small caps, industrials, and cyclical sectors. The market narrative shifted from "AI valuation anxiety" toward "growth reacceleration and capital rotation."
1. AI Infrastructure Rebounds: Semiconductors Lead the Recovery
After several sessions of volatility, AI-related hardware stocks regained momentum.
Semiconductor shares outperformed, supported by renewed confidence in AI infrastructure spending. Investors continued favoring companies directly tied to data-center buildouts, including chipmakers, networking providers, and semiconductor equipment manufacturers. Nvidia remained supported by new AI infrastructure initiatives, while analysts highlighted continued strength across the broader AI supply chain.
Notably, the market continued to distinguish between AI infrastructure beneficiaries and software companies facing monetization questions. Capital flowed toward companies providing the physical backbone of AI rather than those relying primarily on future AI application revenue.
2. Oracle Becomes the Market's New Debate: Growth Is Not Enough
Oracle Corporation(ORCL.US) remained at the center of investor discussions.
The company delivered impressive results on paper:
- Revenue +21% YoY
- Cloud Infrastructure (OCI) +93%
- Remaining Performance Obligations (RPO) reached $638 billion
However, investors focused on the cost side of the equation. Massive capital expenditure requirements, negative free cash flow, and additional financing plans reinforced concerns that AI infrastructure providers may face years of margin pressure before generating meaningful shareholder returns. Oracle shares fell sharply despite the earnings beat.
The market message was clear:
AI demand is no longer enough. Investors increasingly want proof that demand can translate into sustainable cash flow.
3. SpaceX IPO Sparks Market Optimism and Reopens the Innovation Trade
The biggest market event was the highly anticipated IPO of SpaceX(SPCX.US).
Shares surged nearly 20% on the first trading day, and rose about 8% by the report time, making it one of the strongest large-cap IPO debuts in recent history. The successful listing reignited enthusiasm around innovation-driven growth themes, including:
- AI infrastructure
- Aerospace & defense
- Satellite communications
- Advanced manufacturing
- Data-center construction
The IPO's success also helped offset concerns surrounding recent weakness in large-cap technology names and provided fresh momentum for growth-oriented investors.
Related ETF: Defiance Daily Target 2X Long SpaceX ETF(SPCU.US), Defiance Daily Target 2X Long XOVR ETF(XOVL.US).
4. Macro Tailwind: Oil Falls, Risk Assets Rally
The biggest macro catalyst was a sharp decline in oil prices.
Hopes for a potential easing of U.S.-Iran tensions reduced concerns about disruptions around the Strait of Hormuz, sending Brent crude down more than 3%. Lower energy prices relieved inflation fears and improved sentiment toward equities, particularly growth stocks that are sensitive to interest-rate expectations.
Meanwhile, market volatility continued to decline as investors reassessed worst-case geopolitical scenarios.
5. Capital Rotation: Rally Broadens Beyond Mega-Cap Tech
One of the most important developments was market breadth.
While technology remained a key driver, investors increasingly rotated into:
- Small-cap stocks
- Industrials
- Financials
- Cyclical sectors
The Russell 2000 ETF(IWM.US) outperformed major benchmarks, suggesting that investors are becoming more willing to take risk outside the crowded mega-cap technology trade. This broadening participation is generally viewed as a healthier market signal than rallies driven solely by a handful of AI leaders.
Summary: From "AI Stress Test" to "Risk-On Expansion"
June 12 can be characterized as a "confidence restoration day."
The market did not abandon the AI narrative; rather, it refined it. Investors continued to reward companies benefiting from AI infrastructure spending while becoming increasingly selective toward firms requiring enormous capital commitments to support future growth.
The key takeaway:
The AI bull market remains alive, but leadership is broadening. Investors are beginning to favor tangible beneficiaries—semiconductors, equipment, infrastructure, industrials, and even small caps—over crowded narrative-driven trades.
In the near term, lower oil prices, easing geopolitical concerns, and renewed risk appetite could support further upside. However, Oracle's post-earnings reaction serves as a reminder that in the next phase of the AI cycle, cash flow may matter more than backlog.
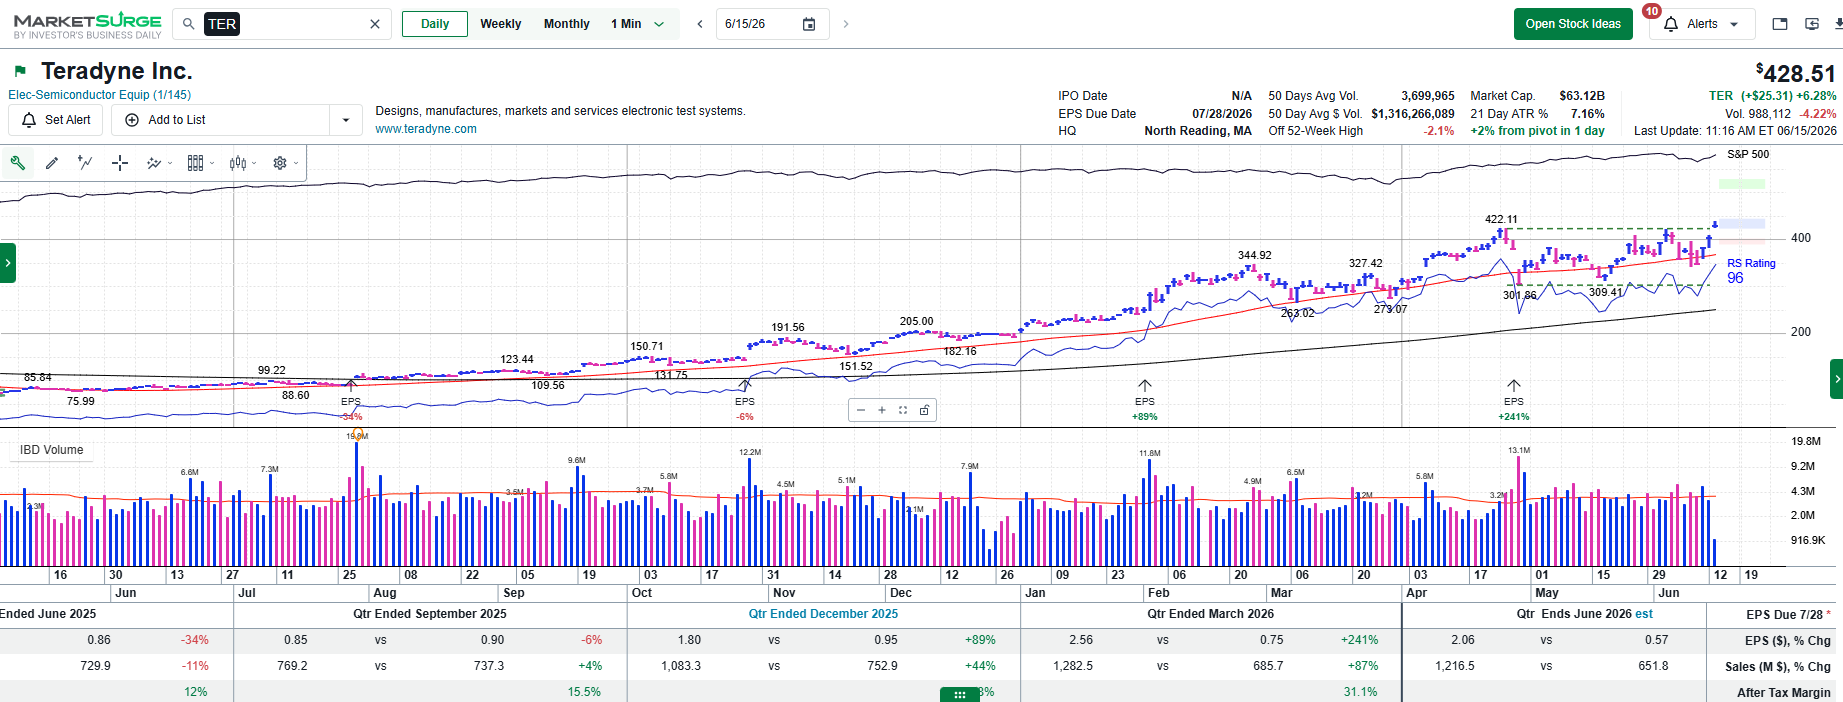
2. Breaking Out Today as of 5:51 pm
| Symbol | Comp Rating | Industry Name | Current Price | Price % Chg | Volume (1000s) | Price $ Chg | EPS Rating | RS Rating | Ind Group RS | SMR Rating | A/D Rating | Market Cap (mil) |
| Teradyne, Inc.(TER.US) | 98 | Elec-Semiconductor Equip | 428.55 | 6.29 | 922 | 25.34 | 92 | 96 | A+ | A | D | 63,117.80 |
| United Airlines Holdings(UAL.US) | 93 | Transportation-Airline | 120.41 | 4.23 | 3,187 | 4.88 | 69 | 77 | B+ | B | A+ | 37,494.30 |
| Unity Bancorp, Inc.(UNTY.US) | 95 | Banks-Regional | 56.23 | -0.71 | 8 | -0.4 | 89 | 65 | A- | A | B | 568.6 |
3. Near Breakouts as of 5:51 pm
| Symbol | Comp Rating | Industry Name | Current Price | Price % Chg | Volume (1000s) | Price $ Chg | EPS Rating | RS Rating | Ind Group RS | SMR Rating | A/D Rating | Market Cap (mil) |
| General Motors Company(GM.US) | 79 | Auto Manufacturers | 83.84 | 2.87 | 1,606 | 2.34 | 89 | 73 | C | C | D+ | 73,485.70 |
| Watts Water Technologies, Inc. Class A(WTS.US) | 95 | Building - Construction Products | 335.06 | 0.59 | 38 | 1.95 | 93 | 70 | B | A | B+ | 11,122.80 |
| Cardinal Health, Inc.(CAH.US) | 79 | Medical-Distribution | 224.64 | 0.35 | 700 | 0.79 | 96 | 68 | D | D | B | 52,427.00 |
| argenx SE(ARGX.US) | 81 | Medical - Profitable Biotech | 889.64 | -0.43 | 91 | -3.88 | 50 | 75 | D+ | A | A- | 56,126.90 |
| Burlington Stores, Inc.(BURL.US) | 97 | Retail-Apparel/Shoes/Acc | 336.56 | -0.56 | 75 | -1.89 | 94 | 74 | B+ | A | A | 21,302.80 |
| U.S. Bancorp(USB.US) | 90 | Banks-Super Regional | 58.47 | -0.81 | 1,960 | -0.47 | 82 | 71 | A- | B | B | 91,492.50 |
| PNC Financial Services Group, Inc.(PNC.US) | 92 | Banks-Super Regional | 234 | -1.54 | 360 | -3.66 | 76 | 74 | A- | B | B+ | 95,435.90 |
Subscribe to The Trend Catcher Topic / The Value Anchor Topic —unlock the full historical archive and never miss a weekly pick again.
Stocks In Focus:
| Company Fundamentals | Details |
|---|---|
| EPS Due Date | 7/23/2026 |
| EPS % Chg (Last Qtr) | 15% |
| 3 Year EPS Growth Rate | 9% |
| EPS Est % Chg (Current Yr) | 261% |
| Annual ROE | 29% |
| Sales % Chg (Last Qtr) | 87% |
| 3-Year Sales Growth Rate | 6% |
| Debt % | 2% |
| Market Cap | $63 Bil |
| Annual Pre-Tax Margin | 36.31% |
| Sector | Chips |
| Industry Group | Elec-Semiconductor Equip |
| Industry Group Rank | 1 |
More of Our Investment Philosophy>>
Disclaimer: The content is provided as general information only and should not be taken as investment advice. All the contents shall not be taken as a recommendation to buy or sell any security or financial instruments. Any action you take resulting from information, analysis, or commentary on this article is your responsibility. Please consult your investment advisor before making any investments.