The Trend Catcher | Stocks Fall on U.S.-Iran War Uncertainty, Market Led by Retail-Mail Order&Direct (+5.49%); 5 Stocks Break Out, Including STLD (+4.67%), APG (+1.55%); 5 More Near Breakout, Led by HMH (+3.48%), TNK (+1.89%)
Dow Jones Industrial Average DJI | 0.00 | |
S&P 500 index SPX | 0.00 | |
NASDAQ IXIC | 0.00 | |
FedEx Corporation FDX | 0.00 | |
Hamilton Insurance Group, Ltd. Class B HG | 0.00 |
Tracking Hottest Sectors & Technical Breakouts in Real Time Daily
The Dow Jones Industrial Average was little changed Monday even after tensions between the U.S. and Iran escalated over the weekend, with traders betting the two countries will eventually reach a compromise. Traders remain hard-pressed to fully price in a worst-case scenario on the war given stocks’ recovery from near correction territory to all-time highs.
As of report, the Dow Jones Industrial Average(DJI.US) lost 93 points, or 0.2%. The S&P 500 index(SPX.US) shed 0.4%, while the NASDAQ(IXIC.US) Composite pulled back 0.7%.
1. Leader industry as of 6:10 pm
| Name | Price % Chg | Ind Group Rank | Ind Grp Rnk Last Week | Ind Grp Rnk 3 Mo Ago | Ind Grp Rnk 6 Mo Ago | Number of Stocks | % Chg YTD | Ind Mkt Val (bil) |
|---|---|---|---|---|---|---|---|---|
| Retail-Mail Order&Direct | 5.49 | 188 | 196 | 12 | 30 | 3 | -58.0 | 0.2 |
| Steel-Producers | 3.36 | 39 | 44 | 44 | 97 | 18 | 18.1 | 222.4 |
| Elec-Contract Mfg | 2.46 | 13 | 23 | 24 | 11 | 16 | 41.8 | 168.3 |
| Utility-Water Supply | 2.40 | 140 | 114 | 136 | 177 | 15 | 3.8 | 73.6 |
| Finance-Publ Inv Fd-Bal | 2.19 | 143 | 128 | 158 | 129 | 32 | 1.6 | 25.8 |
2. Breaking Out Today as of 6:10 pm
| Symbol | Comp Rating | Industry Name | Current Price | Price % Chg | Volume (1000s) | Price $ Chg | EPS Rating | RS Rating | Vol % Chg vs 50-Day | Ind Group RS | SMR Rating | A/D Rating | Market Cap (mil) |
|---|---|---|---|---|---|---|---|---|---|---|---|---|---|
| FedEx Corporation(FDX.US) | 92 | Transport-Air Freight | 392.88 | 0.13 | 252 | 0.51 | 80 | 93 | -40.9 | A | B | A | 93,624.5 |
| Hamilton Insurance Group, Ltd. Class B(HG.US) | 97 | Insurance-Diversified | 32.45 | 1.30 | 112 | 0.41 | 81 | 90 | 9.9 | C | A | A+ | 3,175.5 |
| APi Group Corporation(APG.US) | 94 | Security/Sfty | 47.48 | 1.55 | 469 | 0.72 | 96 | 89 | -7.3 | C- | B | B+ | 20,357.6 |
| Popular, Inc.(BPOP.US) | 89 | Banks-Southeast | 148.93 | 1.38 | 75 | 2.03 | 79 | 86 | -11.6 | B | B | B+ | 9,546.8 |
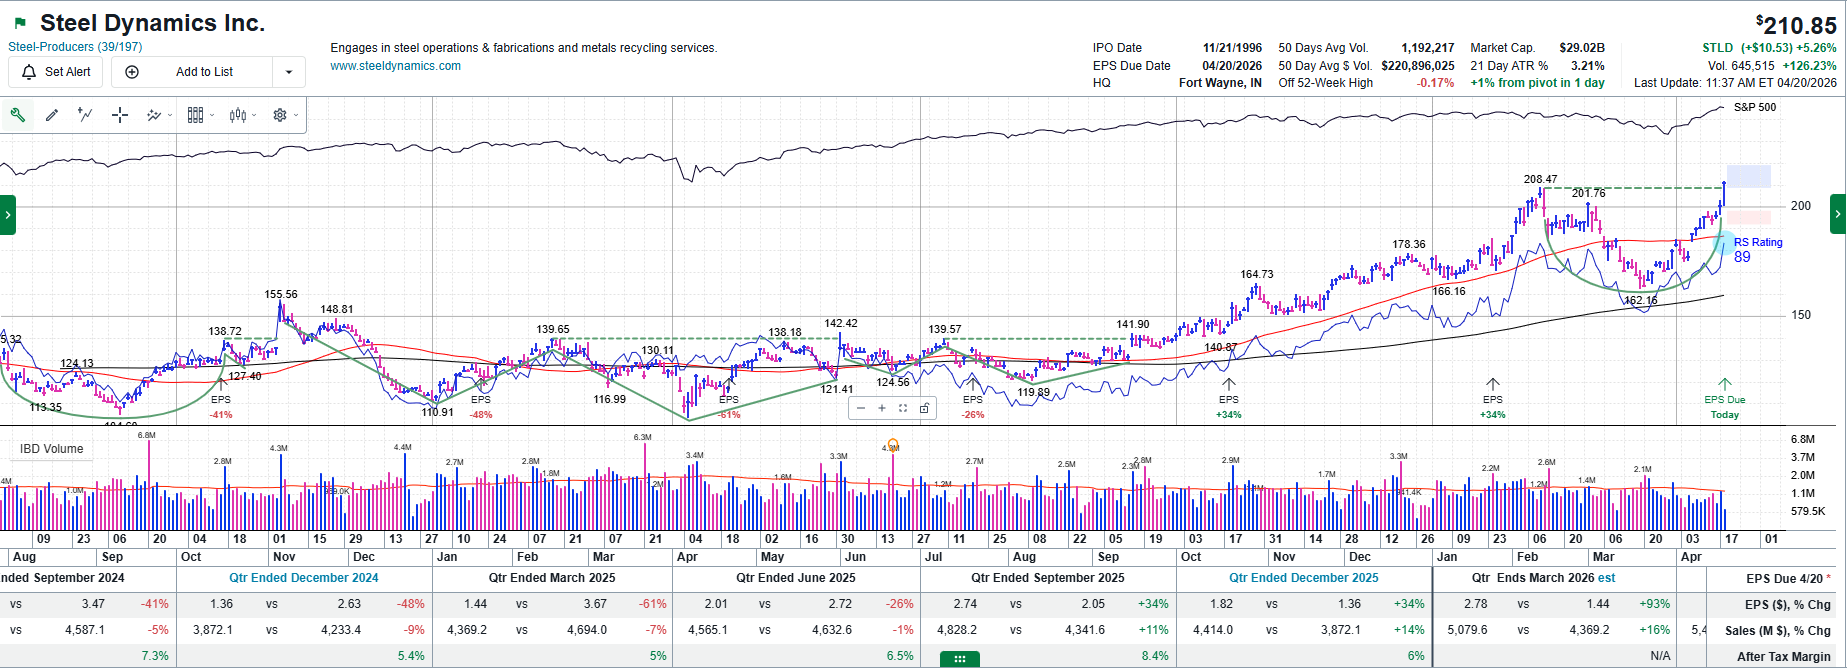
| Steel Dynamics, Inc.(STLD.US) | 90 | Steel-Producers | 209.68 | 4.67 | 550 | 9.36 | 78 | 89 | 123.1 | A- | C | C- | 29,022.8 |
3. Near Breakouts as of 6:10 pm
| Symbol | Comp Rating | Industry Name | Current Price | Price % Chg | Volume (1000s) | Price $ Chg | EPS Rating | RS Rating | Vol % Chg vs 50-Day | Ind Group RS | SMR Rating | A/D Rating | Market Cap (mil) |
|---|---|---|---|---|---|---|---|---|---|---|---|---|---|
| Customers Bancorp, Inc.(CUBI.US) | 95 | Banks-Northeast | 78.47 | 1.36 | 23 | 1.05 | 85 | 81 | -66.0 | A- | A | B+ | 2,648.7 |
| EMCOR Group, Inc.(EME.US) | 95 | Bldg-Maintenance & Svc | 815.45 | 1.17 | 35 | 9.40 | 93 | 90 | -56.9 | B+ | A | C | 35,895.5 |
| Teekay Tankers Ltd Class A(TNK.US) | 89 | Oil&Gas-Transprt/Pipeline | 76.71 | 1.89 | 92 | 1.42 | 69 | 92 | -32.0 | A | C | A- | 2,608.3 |
| HMH Holding, Inc. Class A(HMH.US) | 50 | Oil&Gas-Machinery/Equip | 19.16 | 3.48 | 60 | 0.65 | 46 | 26 | -56.2 | A+ | D | - | 797.7 |
| Texas Capital Bancshares, Inc.(TCBI.US) | 92 | Banks-West/Southwest | 105.84 | 1.20 | 74 | 1.26 | 86 | 82 | -15.2 | B | A | B | 4,623.8 |
Related Stocks Chart
Related Fundamentals
| Metric | Value |
|---|---|
| EPS Due Date | 4/20/2026 |
| EPS % Chg (Last Qtr) | 35% |
| 3 Year EPS Growth Rate | -34% |
| EPS Est % Chg (Current Yr) | 76% |
| Annual ROE | 13.3% |
| Sales % Chg (Last Qtr) | 14% |
| 3-Year Sales Growth Rate | -7% |
| Debt % | 47% |
| Market Cap | $31 Bil |
| Annual Pre-Tax Margin | 8.2% |
| Sector | Metals |
| Industry Group | Steel-Producers |
| Industry Group Rank | 40 |
More of Our Investment Philosophy>>
Disclaimer: The content is provided as general information only and should not be taken as investment advice. All the contents shall not be taken as a recommendation to buy or sell any security or financial instruments. Any action you take resulting from information, analysis, or commentary on this article is your responsibility. Please consult your investment advisor before making any investments.