

US Market Pulse | AI Hardware Reignites + Index Reclaims Ground + Nasdaq Temperature Still in Defensive Zone (Week Ending August 7)
NVIDIA Corporation NVDA | 0.00 | |
Broadcom Limited AVGO | 0.00 | |
Microsoft Corporation MSFT | 0.00 | |
Alphabet Inc. Class A GOOGL | 0.00 | |
Advanced Micro Devices, Inc. AMD | 0.00 |
📅 Week ending August 7, 2026 · Sahm Capital
This is a weekly framework as of the US market close. Objective description only — not investment advice. Markets carry risk; please do your own diligence.
1. Market Snapshot
The tape closed the week with risk appetite back in control. The Nasdaq finished Friday at 26,690.62, up +1.30% on the day and +5.19% over five sessions. The S&P 500 settled at 7,757.64, up +0.62% Friday and +3.58% for the week, while the Dow reached 54,036.93, adding +0.28% and +2.96%, respectively.
This was not a uniform index melt-up. AI infrastructure carried the heavier load: NVIDIA Corporation(NVDA.US) gained +11.56% over five sessions, Broadcom Limited(AVGO.US) rose +9.88%, and Microsoft Corporation(MSFT.US) advanced +7.59%. Underneath that strength, the market was still picking names. Alphabet Inc. Class A(GOOGL.US) fell −0.51% for the week, Advanced Micro Devices, Inc.(AMD.US) managed only +1.51% and remained down −13.36% over 20 sessions, while Tesla Motors, Inc.(TSLA.US) ’s +5.58% bounce did not erase its −19.42% one-month drawdown.
The immediate setup is a market trading tariff relief and renewed AI visibility against stretched positioning, selective earnings reactions and a fresh Gulf-risk bid in oil. The indices recovered quickly, but the temperature readings show that the internal risk posture is not moving in lockstep.
🔔 Subscribe to The Trend Catcher Topic / The Value Anchor Topic
The Trend Catcher / The Value Anchor — unlock the full historical archive and never miss a weekly pick again.
2. DPWD Temperature Gauge & Index Position
DPWD is our original gauge built on three objective technical factors: moving average, MACD and RSI. Its readings reflect market temperature. Zones: ≥95 Aggressive / 85–95 Active / 75–85 Neutral / 65–75 Defensive / <55 Extremely Defensive. Chart window: last 120 trading days (calculations use full history).
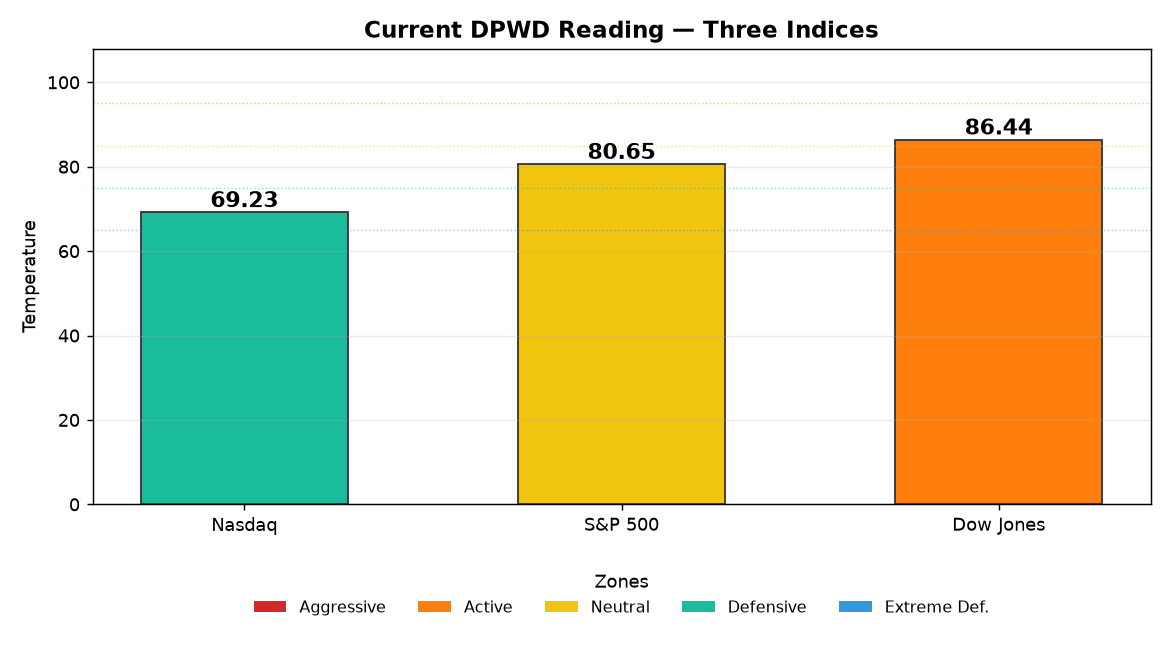
Figure 1 — DPWD temperature reading across the three major indices (TEMP10).
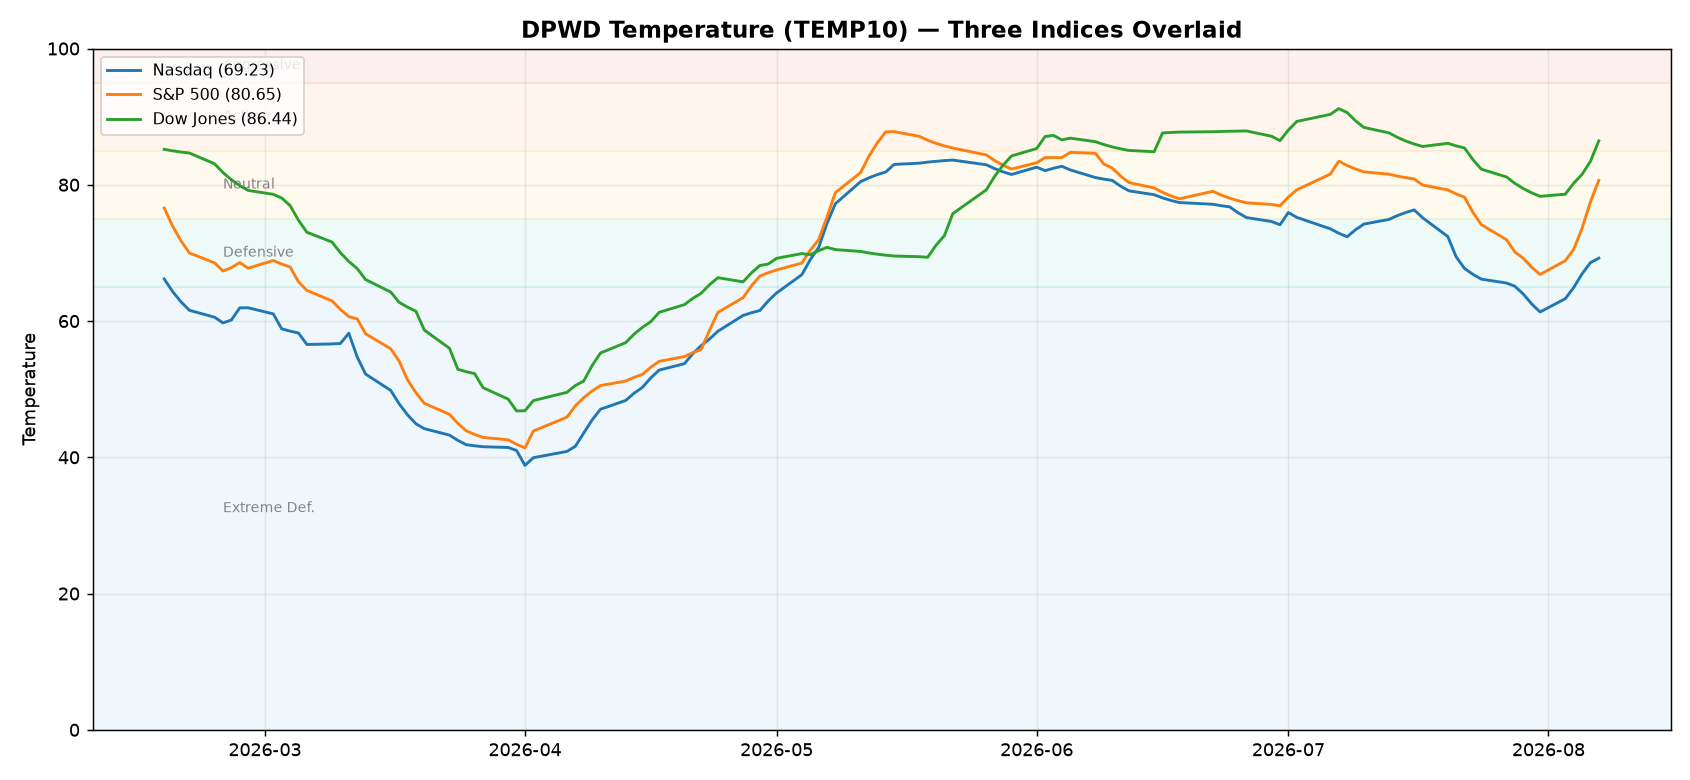
Figure 2 — 120-trading-day DPWD temperature trend (overlay).
| Index | Close | DPWD | TEMP10 | Zone |
|---|---|---|---|---|
| NASDAQ(IXIC.US) | 26,690.62 | 72.2 | 69.23 | Defensive |
| S&P 500 index(SPX.US) | 7,757.64 | 95 | 80.65 | Neutral |
| Dow Jones Industrial Average(DJI.US) | 54,036.93 | 100 | 86.44 | Active |
The DPWD spread is the key tell. Nasdaq price momentum looks aggressive, but its 69.23 TEMP10 remains in the defensive zone. The Dow, despite the slowest Friday gain, carries the hottest reading at 86.44 in the active zone. That divergence suggests the headline AI rally is stronger than the broader risk temperature inside growth.
The S&P 500 sits between those two regimes. Its 80.65 reading is neutral, consistent with an index benefiting from mega-cap participation without showing the same defensive temperature as Nasdaq or the same broad cyclical activation as the Dow.
Index Technical Position
Nasdaq — momentum recovered faster than temperature. The Nasdaq closed at 26,690.62 after a +5.19% five-day surge. The 5-day moving average has turned higher relative to the 10-day line, while price has moved back above the short-term MA cluster; the broader 10/20-day structure remains less decisive after the prior congestion. The nearest visible support is around 26,000, with resistance concentrated near the 27,000 round-number area. TEMP10 at 69.23 remains in the defensive zone, showing that the rebound in price has not yet produced an equally strong internal temperature reset.
S&P 500 — orderly short-term recovery. The S&P 500 finished at 7,757.64, with the 5-day MA rising above the 10-day line and price holding above both short-term averages. The 20-day trend remains constructive but less steep than the latest weekly move. Immediate support sits near 7,700, while 7,800 is the closest resistance and psychological congestion level. TEMP10 at 80.65 is in the neutral zone, matching a tape that has recovered without reaching an active-risk extreme.
Dow Jones — broad-market temperature leads. The Dow closed at 54,036.93 and has its 5-day and 10-day MAs turning higher, with price pressing above that short-term alignment. The index is testing the 54,000 area rather than breaking cleanly away from it; nearby support is around 53,500, and resistance sits near 54,500. TEMP10 at 86.44 is in the active zone, the strongest of the three major indices and evidence of firmer participation outside the pure growth complex.
3. What the Market Is Trading
AI infrastructure is back in the driver’s seat. NVIDIA Corporation(NVDA.US) closed at 223.96, up +2.27% Friday, +11.56% over five sessions and +6.16% over 20 sessions. Broadcom Limited(AVGO.US) followed with a +9.88% weekly gain, while Microsoft Corporation(MSFT.US) added +7.59% and remained up +29.83% over 20 sessions. The market is trading visibility: hyperscaler spending, custom accelerators, networking and memory demand are receiving a higher multiple than less defined AI exposure.
The semiconductor trade is fragmenting. NVIDIA Corporation(NVDA.US) and Broadcom Limited(AVGO.US) are acting like AI-capex beneficiaries, but Advanced Micro Devices, Inc.(AMD.US) closed down −1.21% Friday and remains −13.36% over 20 sessions despite a +1.51% weekly recovery. That gap reflects more than simple beta. The tape is separating revenue acceleration from margin conversion, competitive positioning and product-ramp execution. Strength in Taiwan Semiconductor and attention around memory pricing reinforce the infrastructure theme, while weakness in SK Hynix below key moving averages shows that not every AI-linked chart is receiving the same bid.
Mega-cap breadth remains selective. Meta Platforms(META.US) rallied +6.36% over five days but is still down −11.52% over 20 sessions. Amazon.com, Inc.(AMZN.US) gained only +1.07% for the week despite an +11.88% one-month advance. Apple Inc.(AAPL.US) finished at 313.33, nearly flat on Friday and down −0.63% over 20 sessions, while Alphabet Inc. Class A(GOOGL.US) lost −0.96% Friday. Capital is not simply chasing the entire mega-cap basket; it is rotating toward names with the clearest near-term earnings and infrastructure narrative.
Tesla Motors, Inc.(TSLA.US) is bouncing, but the damaged chart still matters. Tesla Motors, Inc.(TSLA.US) rose +2.83% Friday and +5.58% over five sessions, yet the stock remains down −19.42% over 20 sessions. The move has the shape of a tactical rebound from de-risked conditions rather than a complete technical repair. The distinction between a durable base and a dead-cat bounce remains embedded in how price behaves around the next congestion zone.
Tariff relief is lowering the policy premium, not removing it. A softer tariff backdrop has opened room for cyclicals and hardware, but potential restrictions on Chinese optical components for AI data centers keep supply-chain policy in play. The deeper trade is therefore two-sided: easing broad tariff pressure supports multiples, while targeted technology controls can still produce sharp winners, losers and inventory shifts.
4. Sectors & Flows
| Name | Close | Day % | 5d % | 20d % | Note |
|---|---|---|---|---|---|
| NVIDIA Corporation(NVDA.US) | 223.96 | +2.27% | +11.56% | +6.16% | AI accelerator leadership |
| Broadcom Limited(AVGO.US) | 427.76 | +1.71% | +9.88% | +6.95% | Custom silicon and networking visibility |
| Microsoft Corporation(MSFT.US) | 499.99 | +0.03% | +7.59% | +29.83% | Strongest mega-cap medium-term trend |
| Meta Platforms(META.US) | 592.10 | +0.37% | +6.36% | −11.52% | Sharp bounce inside a damaged monthly structure |
| Tesla Motors, Inc.(TSLA.US) | 328.58 | +2.83% | +5.58% | −19.42% | Rebound after heavy de-risking |
| Advanced Micro Devices, Inc.(AMD.US) | 483.36 | −1.21% | +1.51% | −13.36% | AI growth offset by margin and execution debate |
| Apple Inc.(AAPL.US) | 313.33 | +0.29% | +1.43% | −0.63% | Range-bound relative performance |
| Amazon.com, Inc.(AMZN.US) | 274.48 | +0.82% | +1.07% | +11.88% | Positive monthly trend, quieter weekly tape |
| Alphabet Inc. Class A(GOOGL.US) | 354.30 | −0.96% | −0.51% | −0.81% | Lagging mega-cap participation |
| Flow | Sector / Names | Signal |
|---|---|---|
| Inflow | AI accelerators: NVIDIA Corporation(NVDA.US) , Broadcom Limited(AVGO.US) | Strong five-day momentum and renewed earnings visibility |
| Inflow | Cloud and platform capex: Microsoft Corporation(MSFT.US) | Capital spending is being rewarded where monetization remains visible |
| Selective | Memory, storage and foundry names | Pricing power and long-term agreements matter more than blanket semiconductor beta |
| Rotation | Dow cyclicals and broad-market exposure | DPWD temperature is hotter than the price leadership alone implies |
| Repair trade | Meta Platforms(META.US) , Tesla Motors, Inc.(TSLA.US) , Advanced Micro Devices, Inc.(AMD.US) | Weekly rebounds remain inside negative 20-day structures |
| Outflow / lagging | Alphabet Inc. Class A(GOOGL.US) and lower-conviction mega-cap exposure | Index strength is not translating into uniform participation |
| Event-driven | Optical components and China-linked supply chains | Policy headlines can alter sourcing, inventory and relative pricing power |
5. Key Catalysts This Week
- AI hardware follow-through: The market is testing whether the +11.56% weekly move in NVIDIA Corporation(NVDA.US) and +9.88% gain in Broadcom Limited(AVGO.US) can broaden into memory, optical networking, testing equipment and data-center power names.
- Trade-policy details: Tariff easing has lowered the broad risk premium, while potential restrictions on Chinese optical components remain a targeted supply-chain catalyst.
- Oil and Gulf risk: Crude is edging higher as Gulf uncertainty persists. A sustained energy move would feed into inflation expectations, transport costs and the relative performance of cyclicals versus long-duration growth.
- Asia semiconductor signals: Trading in Taiwan Semiconductor, SK hynix Inc. Sponsored ADR(SKHY.US) and the wider Asian hardware complex provides a read-through for US semiconductor demand, memory pricing and AI-capex durability.
- Mega-cap divergence: Microsoft Corporation(MSFT.US) ’s +29.83% twenty-day run contrasts with negative twenty-day returns in Alphabet Inc. Class A(GOOGL.US) , Meta Platforms(META.US) , Tesla Motors, Inc.(TSLA.US) and Advanced Micro Devices, Inc.(AMD.US) . Earnings revisions and capex commentary are likely to keep stock selection more important than basket exposure.
- Liquidity and positioning: After the Nasdaq’s +5.19% weekly rebound, the reaction to crowded AI exposure will reveal whether flows are fresh risk allocation or primarily short-covering and performance chasing.
6. Institutions & Research
AI capex: sustainability is now the question. Goldman Sachs analysts frame the investment cycle around the current pace of AI spending and the ability of that spending to generate durable economic returns. Citi’s work argues that consensus still understates AI-linked revenue and return potential, while also pointing to a broader buildout of power and supporting infrastructure across the United States. The common thread is that the market is moving beyond a simple capex-growth story and placing greater weight on utilization, monetization and free-cash-flow conversion.
Semiconductors: visibility is outranking generic exposure. Morgan Stanley’s semiconductor analysis emphasizes earnings differentiation across Advanced Micro Devices, Inc.(AMD.US) , Astera Labs, GlobalFoundries, memory and equipment names. JPMorgan sees scope for Advanced Micro Devices, Inc.(AMD.US) ’s data-center growth to outpace overall AI-infrastructure spending into 2027, but flags the margin dilution associated with rapidly scaling data-center GPUs. Citi’s view on Broadcom Limited(AVGO.US) highlights improving AI visibility extending toward 2028, consistent with the stock’s +9.88% weekly move.
Memory: contracts and pricing power are driving the debate. Goldman’s team focuses on HBM pricing, long-term agreements, inventories and Chinese DRAM capacity. Citi similarly emphasizes stronger demand visibility for Western Digital and SanDisk through longer-term commercial arrangements, although improved visibility can come with pricing volatility. The market implication is that memory names are being judged on contract quality and cash-flow durability rather than spot-price momentum alone.
Optical networking: policy risk intersects with AI demand. Citi and Morgan Stanley examine the potential impact of US restrictions on Chinese optical components used in AI data centers. The demand backdrop remains tied to rising cluster scale and bandwidth intensity, but sourcing constraints could redistribute orders across suppliers. That makes optical exposure particularly sensitive to policy wording, inventory buffers and the qualification timelines for alternative components.
Positioning: crowded leadership raises the bar. BofA’s flow framework and JPMorgan’s liquidity work point to the importance of positioning after a sharp recovery in growth assets. Bernstein’s software analysis asks how crowded software exposure has become as the market enters the second half of 2026. The key distinction is between crowded names still receiving positive earnings revisions and crowded names relying mainly on multiple expansion.
AI adoption: labor disruption remains gradual but visible. Morgan Stanley characterizes the labor-market impact of AI as modest so far but increasingly observable. Its broader thematic work on open-weight models highlights different adoption paths for software, cybersecurity and networking. Goldman’s analysis of AI models likewise focuses on the trade-off between performance, price and multimodal capability, suggesting that value capture may spread unevenly across infrastructure, applications and security.
Consumer and retail: demand quality remains a cross-check. JPMorgan’s retail framework keeps attention on discretionary spending and household sensitivity to policy and financing conditions. Weak mortgage-application signals in Australia and the sharp reaction in Westpac underline the global sensitivity of consumer-linked financials to tax and housing changes, even as the US equity tape remains focused on AI and tariff relief.
7. Signals Worth Tracking
- Nasdaq price versus DPWD temperature: The index gained +5.19% over five sessions, but TEMP10 remains defensive at 69.23. A narrowing or widening of that gap will show whether participation is catching up with price.
- The S&P 500 at 7,800: The 7,800 area is the nearest round-number resistance after the close at 7,757.64. The character of trading around that zone will reveal whether the rebound is absorbing supply or returning to congestion.
- Dow participation near 54,000: The Dow’s 86.44 active-zone temperature is stronger than its +0.28% Friday move suggests. Sustained breadth around 54,000 would confirm that flows are not confined to AI.
- NVDA and AVGO leadership: Five-day gains of +11.56% and +9.88% set a high momentum bar. Relative performance in networking, memory, optical and power infrastructure will indicate whether the AI trade is broadening.
- MSFT extension: Microsoft Corporation(MSFT.US) is up +29.83% over 20 sessions and closed just below 500 at 499.99. Price behavior around that round number is a clean gauge of appetite for extended mega-cap winners.
- Damaged-chart rebounds: Meta Platforms(META.US) , Tesla Motors, Inc.(TSLA.US) and Advanced Micro Devices, Inc.(AMD.US) rallied over five sessions while remaining down −11.52%, −19.42% and −13.36% over 20 sessions. Their next consolidation will distinguish technical repair from short-covering.
- Oil and technology-policy headlines: Gulf risk and targeted component restrictions remain potential volatility channels for inflation expectations, supply chains and semiconductor relative performance.
Market data from public market sources; research views from sell-side and public reporting.