XPLR Infrastructure (XIFR) Turns Trailing Profit, Testing Bullish Growth Narratives
XPLR Infrastructure, LP XIFR | 10.21 | -1.07% |
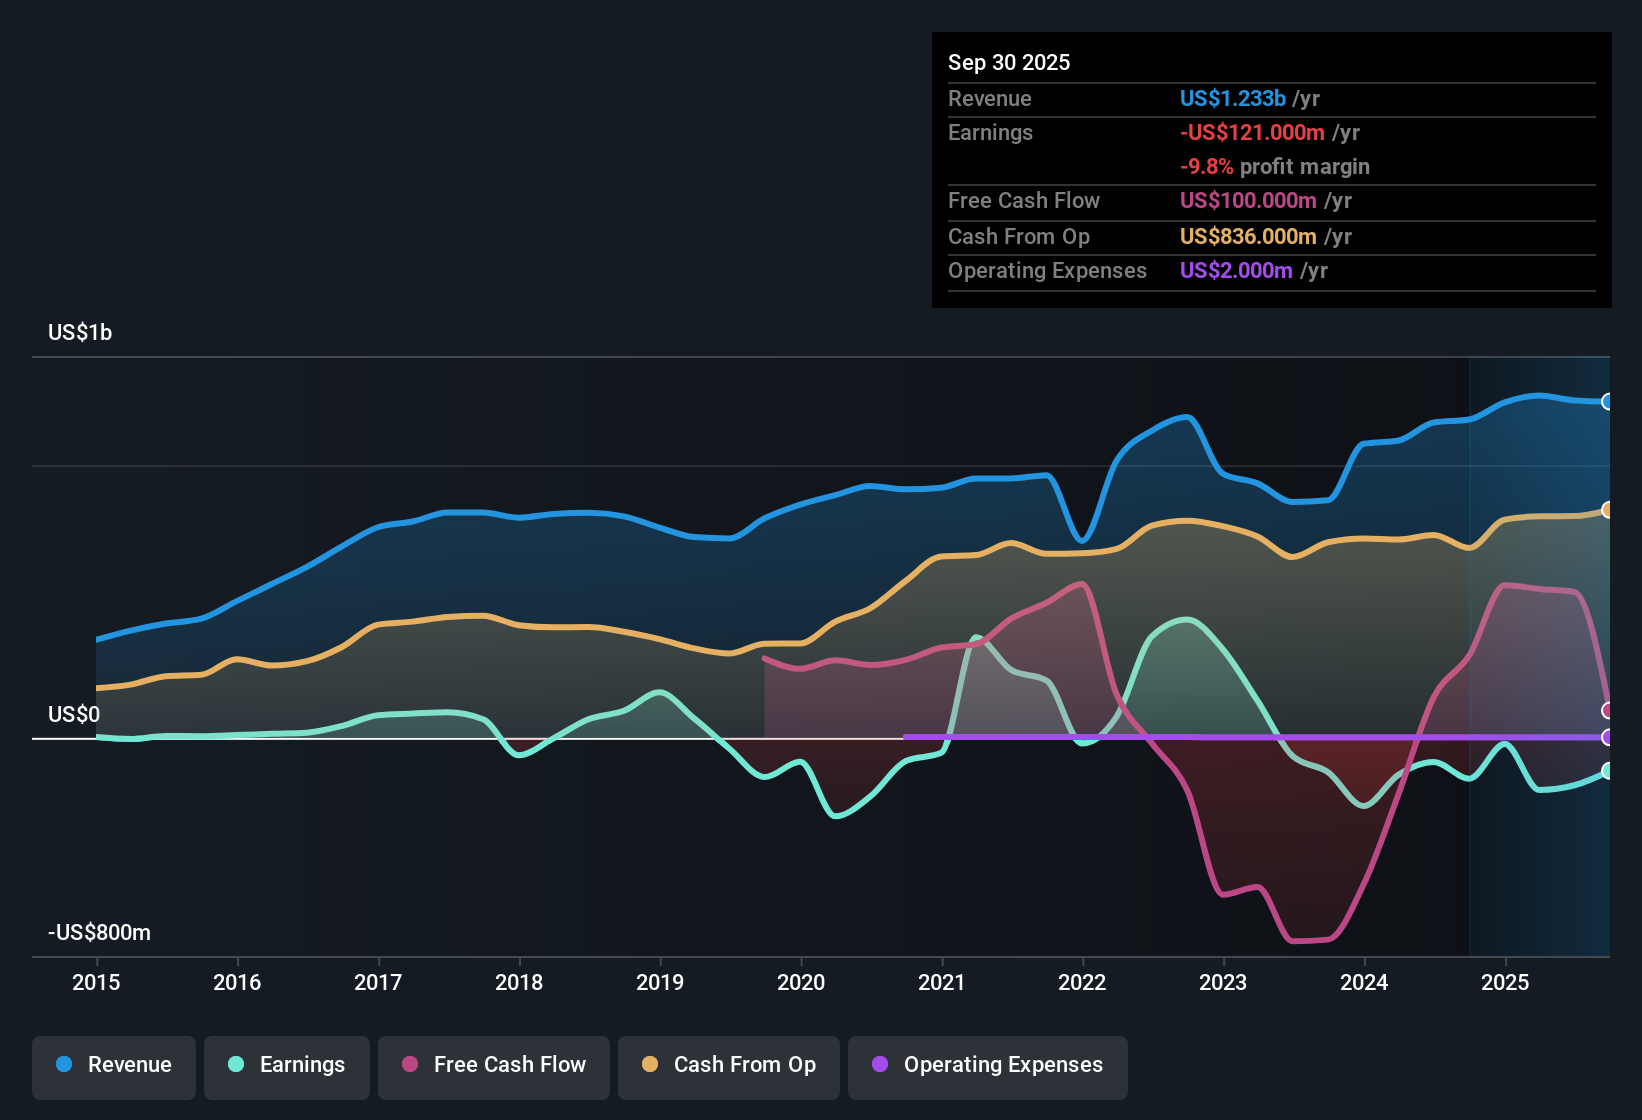
XPLR Infrastructure (XIFR) has wrapped up FY 2025 with fourth quarter revenue of US$249 million and basic EPS of US$0.31, while the trailing twelve months show total revenue of US$1.19 billion and basic EPS of US$0.10. Over recent quarters, revenue has moved between US$282 million and US$342 million, with basic EPS ranging from a loss of US$1.05 to a profit of US$0.84, as trailing net income excluding extra items shifted to a modest profit of US$9 million. For investors, a key question now is how durable these thinner margins and the recent move into profitability appear as a foundation for assessing earnings quality.
See our full analysis for XPLR Infrastructure.With the headline numbers on the table, the next step is to see how these results align with the prevailing narratives around XPLR Infrastructure, highlighting where the story is consistent and where the earnings profile raises fresh questions.
Profit swings around a small US$9 million gain
- On a trailing twelve month basis, XPLR Infrastructure moved from sizeable losses earlier in the year to a modest profit of US$9 million, with quarterly net income excluding extra items ranging from a loss of US$98 million in Q1 FY 2025 to a profit of US$79 million in Q2 and US$29 million in Q4.
- What stands out to bullish investors is how this profit shift lines up with a forecast that earnings could grow about 57.1% per year. However, the recent record still includes large quarterly losses, which means the bullish story leans heavily on future execution rather than a long history of steady profits.
- Bullish assumptions reference profit margins moving from roughly breakeven today to far higher levels in a few years. At the same time, the recent quarters show EPS moving between a loss of US$1.05 and a profit of US$0.84 per share.
- This tension between a small trailing profit and very strong earnings growth assumptions is a reminder to check whether you are comfortable with the size of the jump from US$9 million of trailing earnings to the much higher figures in the bullish case.
High 116.1x P/E against peers
- The shares trade on a trailing P/E of 116.1x, compared with a peer average of 28.9x and a Global Renewable Energy industry average of 16.3x, while the current price of US$11.12 sits well below both the DCF fair value of US$44.55 and an analyst consensus price target of US$11.45.
- Bears highlight that paying such a high multiple on only US$9 million of trailing earnings leaves little room for disappointment, even though the DCF fair value and analyst target suggest upside from the current share price.
- The gap between the current P/E of 116.1x and the much lower peer and industry levels supports the bearish concern that the stock screens as expensive on recent earnings, regardless of future forecasts.
- At the same time, the DCF fair value of US$44.55 versus a US$11.12 price challenges a simple bearish view, because it shows at least one valuation approach in the data that points to a very different conclusion than the trailing P/E alone.
Weak interest cover and one off US$244 million loss
- Over the last 12 months, results were hit by a one off loss of US$244 million and interest coverage is flagged as weak because earnings do not comfortably cover interest payments, even though trailing net income excluding extra items has just turned positive at US$9 million.
- Analysts’ consensus narrative talks about using retained earnings and debt to fund buyouts and growth projects, and these figures show why the balance between growth plans and financial risk matters so much.
- The large US$244 million one off loss in the trailing figures means part of the recent history is not from recurring operations, which can make it harder to judge how much of the new profitability is repeatable.
- Weak interest coverage ties directly to the plan to use debt alongside retained cash, because higher interest costs on that debt would run through earnings in the same way and could keep reported profit tight even if revenue grows.
Next Steps
To see how these results tie into long-term growth, risks, and valuation, check out the full range of community narratives for XPLR Infrastructure on Simply Wall St. Add the company to your watchlist or portfolio so you'll be alerted when the story evolves.
Spot something in the figures that points you in a different direction? Shape that view into your own narrative in just a few minutes and Do it your way.
A great starting point for your XPLR Infrastructure research is our analysis highlighting 3 key rewards and 2 important warning signs that could impact your investment decision.
See What Else Is Out There
XPLR Infrastructure combines a very high 116.1x P/E, thin US$9 million trailing profit, weak interest cover, and a large one off US$244 million loss. This combination may concern risk aware investors.
If you are uneasy about those tight margins and funding pressures, use our 83 resilient stocks with low risk scores to quickly focus on companies where earnings cover debt costs more comfortably.
This article by Simply Wall St is general in nature. We provide commentary based on historical data and analyst forecasts only using an unbiased methodology and our articles are not intended to be financial advice. It does not constitute a recommendation to buy or sell any stock, and does not take account of your objectives, or your financial situation. We aim to bring you long-term focused analysis driven by fundamental data. Note that our analysis may not factor in the latest price-sensitive company announcements or qualitative material. Simply Wall St has no position in any stocks mentioned.